Understanding Google My Business & Local Search
Home

Want to Read My Current Work?
I have moved my efforts to Near Media, where I contribute to our newsletter and share our Local SEO/Google Local research findings, cover local news and provide analysis. While there I would hope that you would sign up for our newsletter covering the local space. See you there!
Google Local Spam Hall of Fame: Just How Long Can a Google My Business Name Be?
TL;DR – Really long I know this is the moment you have all been waiting for. Just how long can a name in Google My Business be? Well Jeffrey Magner of BigHorn Local SEO in Sisters, OR took the challenge to answer that burning question and he used his own listing as the guinea pig. …
Google Local Spam Hall of Fame: We Have Some (real?) Winners
After several days of heated competition, the judges are pleased to announce the winners of the Google Local Hall of Fame Name Abuse competition. As a reminder there were two categories to determine the longest name: Longest Name in the Wild (winner will be announced in a separate post) Google Character Limits on Name Length …
Want to Read My Current Work?
I have moved my efforts to Near Media, where I contribute to our newsletter and share our Local SEO/Google Local research findings, cover local news and provide analysis. While there I would hope that you would sign up for our newsletter covering the local space. See you there!
Mike B Around the Universe (Which is the Webs)
Articles: Analysis Image Packs and the Localization of Google Product Search In the past, image search optimization was complicated and returns were minimal for local businesses. That’s all starting to change. Analysis Confessions of a Google Local Guide Google Google incentivizes quantity over quality with user-generated content. Local businesses should take control of their profile …
Mike B: Around the Web, I Look at Yelp and More
Every week I look forward to my work at LocalU and Near Media. Be sure to catch the article on Yelp. As a reminder, the FeedBurner email feed of my posts is going away soon. If you want to follow my writing subscribe to the Near Media Newsletter where I am joining David Mihm and …


An Updated List of Apple Business Listing Data Providers
Interested in who provides business listing data to Apple Maps? With rollout of iOS 9 Apple is becoming ever more important in local search. This fact struck home early this year when a major theme park contacted me and said that people were piling up at their service entrance instead of their front gate. Turned …

Thoughts on the Recent Rollout of Aggregate Reviews, Snippets & Critic Reviews in Google SERPS
Since early August with the roll out of Critic Reviews and Top 10 Lists and with the recent rollout of Reviews from the web and a significant review snippet display upgrade, Google has been on a rich snippet tear. Here are some my thoughts, big and small, about these changes. Do you see these changes …
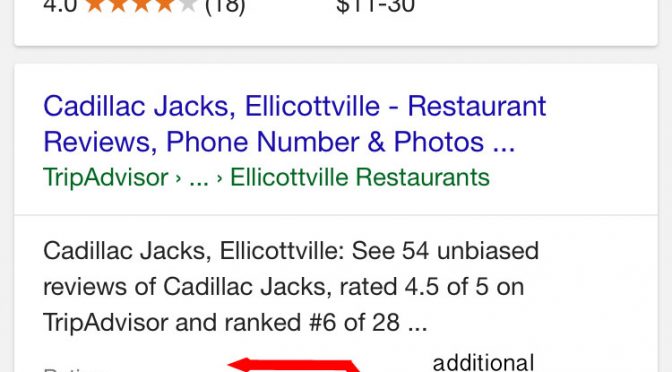
Google Updates Mobile Rich Snippet Display with Pricing Information
In addition to the release of Reviews from the web and new review rich snippet guidelines (again), Google has simultaneously updated the display of mobile organic review rich snippets with more space and additional pricing details. H/T to Aaron Weiche, the CMO at GetFivestars. Although Jared McKiernan of ParkWhiz asks some interesting questions:

A Plug-in for Adding Google Reviews to Your WordPress Blog
Update: I just heard from David Deering about the plug-in’s use of Schema. Firstly the schema is not done correctly. More importantly however (which I suspected but didn’t investigate as I thought the schema was reserved for the paid version… mea culpa) marking up reviews and ratings that were created on another site actually goes against …
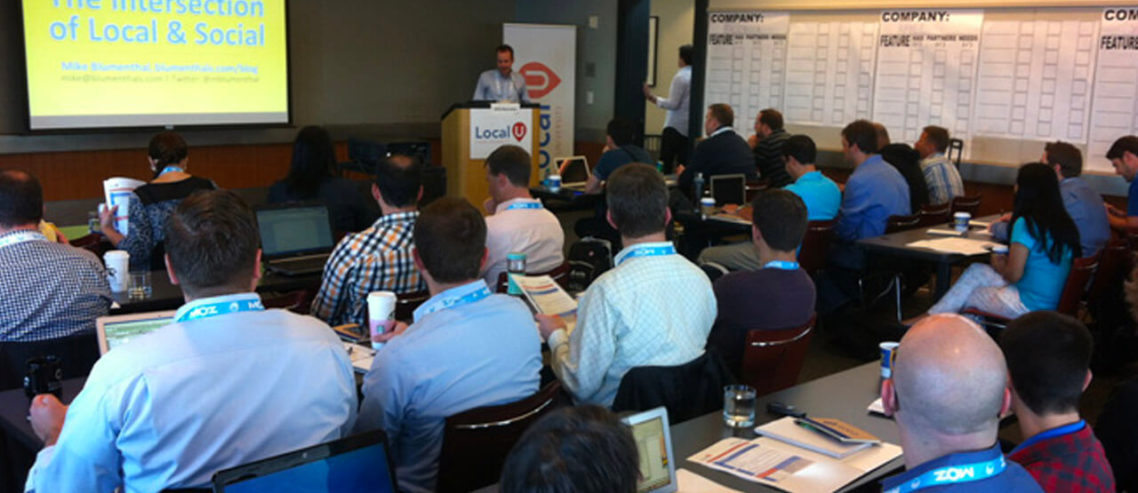
Local U Advanced – Seattle – June 10th
Local U Advanced is returning to Seattle on June 10th with an all new curriculum for 2014. When asked what attendees liked best about our just completed Local U Advanced in Philadelphia here is what a few of them said: How intimate the group is and the ability to talk to the presenters before, during and after presentations. All …
Local U Advanced – March 8th – King of Prussia, PA
Update: 3/3/14: Only 11 seats left. There are only 9 days left until our next Local U Advanced, just outside of Philadelphia, at the DoubleTree by Hilton in King of Prussia, Pa. This year we have limited the total ticket sales (including sponsor seating) to just 65 folks. As of yesterday afternoon there were only …
© Copyright 2025 - MIKE BLUMENTHAL, ALL RIGHT RESERVED.