Understanding Google My Business & Local Search
Post Pigeon Geo Assessment – How Did Traffic Change by City Part 2
Moses and Rooth Attorneys at Law is a two location criminal defense practice with one office in central Orlando and one in New Smyrna Beach on the coast. I wanted to do a visual mapping comparison of pre and post Pigeon impacts like I did with Barbara Oliver Jewelry & Co. to see the impact of Pigeon both locally and regionally and to see how these changes were distributed geographically. I examined the period from July 27th to October 25th and compared it to a similar length period that ended July 26th.
Being in a bigger city than Barbara and having two locations, I thought it might offer an interesting comparison for better understanding Pigeon.
On the surface the post Pigeon report card for Moses and Rooth was not good, showing overall web traffic and web traffic in the state of Florida both showing a decrease of sessions in -10.5% range.
However all was not bad. When you dig in and look at a more granular level you find that in Orlando sessions were up 23.93% and in New Smyrna Beach they were up 45.45%. In their greater metro area of Orlando-Daytona Beach-Melbourne FL Metro traffic was down 1.73%. About even.
When you look at the change across cities you see a chart that is very similar to Barbara Oliver’s.
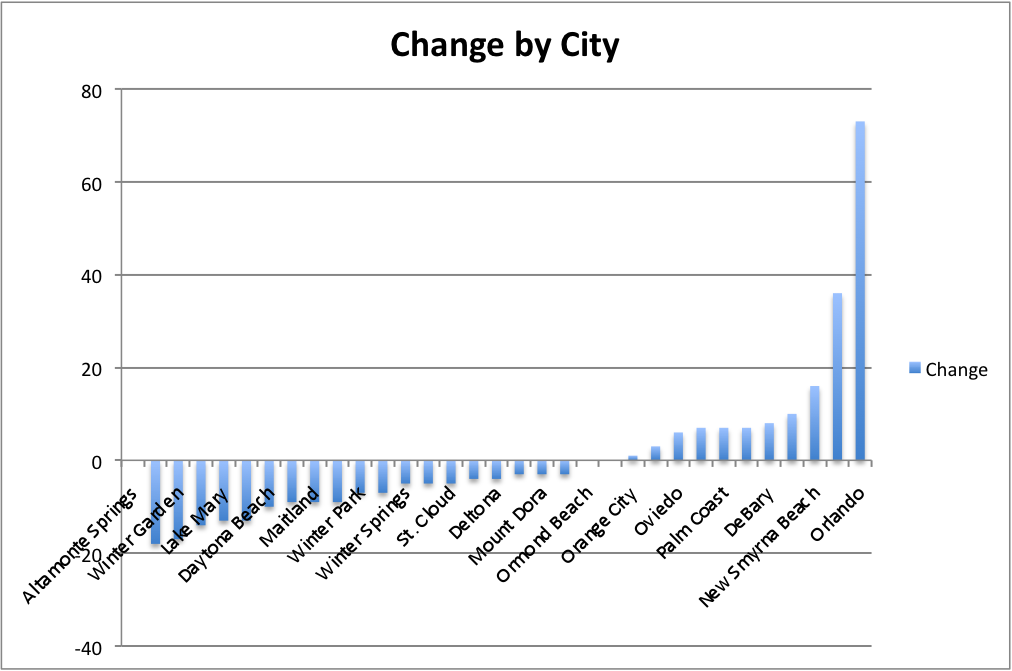
There is however a difference. In both cities where Moses and Rooth have their office located they saw an increase in traffic. In some sense, I think that this was what Pigeon was all about. As Google has gained a better understanding of searcher location on the desktop, they have increased localization of searches increasing the likelihood that those searchers closer to the business have an increased chance of seeing that business. This isn’t so much about proximity to a centroid as proximity to the searcher.
It makes sense that Google would reduced visibility of Moses and Rooth across Florida but increase their visibility in the specific markets in which they reside. It also appears that while out of market traffic was down, in market traffic was about flat.
While this might reduce some opportunities for Moses and Rooth, it frees up Google local search inventory for other businesses that are closer to the searcher as Google currently understands it. Thus if you are located within an area where more searches are taking place (i.e. dense urban centers) you will have likely improved your specific local traffic but you may have lost more regional traffic for which you were showing. As Adam Dorfman pointed out in SearchEnginland, this may not result in increased conversions. Although I don’t think that will always be the case. It would be business, location and searcher dependent. It appears to be much more complex than just a proximity to centroid issue.
Here is a view of the change by city data plotted geographically. Note that their offices are the Black pins and that while their cities of office location showed the biggest increases some nearby cities showed some decreases:
Key: Blue reflect the increases with the darker blues being the greatest increase. The reds and oranges are the decreases with the darker reds being the biggest decrease and the lighter oranges reflecting the smallest decreases.

I am curious what others have seen post Pigeon. Has relevant local traffic increased or decreased? What has overall traffic done? What about other metrics for local success?


© Copyright 2026 - MIKE BLUMENTHAL, ALL RIGHT RESERVED.
Comments
24 Comments
Nice analysis, Mike.
This probably isn’t something you can comment on specifically regarding Moses and Rooth, but I wonder how the more-local uptick in traffic has corresponded with phone calls. Is business a little better?
Presumably the traffic is a little higher-quality, because searchers are closer and don’t have to content with a long drive. OTOH, I think most people are willing to drive a bit for the right attorney. They’re not car mechanics or restaurants.
In real life the degree of “local intent” depends on the industry, so it would be interesting to know whether Pigeon has made the results more location-sensitive in some industries than in others.
Mike I’m just wondering why you didn’t compare the year over year data? Like most businesses couldn’t the fluctuation in traffic be seasonal ?
@chris
The reason was that I was trying to limit the view to a timeframe during which Pigeon had the most obvious impact in an effort (however lame) of isolating it’s impact.
If I go back a year there are an almost infinite number of Google, hosting and ecosystem changes that have occurred that it makes any Pigeon understanding cloudy.
Certainly from a business POV they would want to do a y/y to understand the business issues but I wanted to focus on Pigeon and compare the results to the one I did for Barbara Oliver.
@Phil
You are right I probably couldn’t talk about phone traffic even if I had the numbers (which I don’t).
But you hit the nail on the head that people are willing to drive much further for certain types of businesses than others and it isn’t clear to me that the location refinements of Pigeon really acknowledge that reality.
Is it possible to compare the Google Trend data for their services and determine if this might be a normal decrease in traffic?
Trends might give you some clue but given that the keywords are not known, we can’t really nail it down. Certainly the change in volume could be seasonal. No doubt about it.
I don’t think the shift in cities where a business is getting visitor from is. I am confident that the shift in what cities are sending traffic is very much due to Pigeon. The similarities in the net change graph to Barbara Oliver convinces me of that.
Interesting location info… showing Pigeon providing sort of odd search location results.
Mike: I did an analysis of post pigeon results as you did. I did it roughly simultaneously with your first report.
I find enormous unknowns. I stopped doing them. From a business perspective I want to know what helps and hurts the business.
I suppose from an SEO perspective one could do these reports. But are they informative or not.
Here are some things I don’t know from the reports and from your analysis:
1. Seasonal comparisons as Chris McCreery asked above. That is SO critical. Web traffic can SOAR and shrink dependent on seasonality.
I’d rather check “pigeon impact” against same time periods year to year. You might not get “immediate pigeon” diffferences” but you get “location traffic” differences comparing same time periods.
2. What is the total traffic for my business phrases during this time period.
I can’t know that. Unless I’m using widespread adwords tied to my region. That helps with an enormous amt of hard data and knowledge I wouldn’t have otherwise.
Of course its expensive (or relatively not).
On that point of total traffic for my industry phrases…suppose the traffic increased by 40% and my “pigeon traffic” increased by 5%. I’m really not doing that well overall. Conversely if that traffic increased 5% and the “pigeon traffic” increased 40% I love it.
3. As to “pigeon traffic” or potential local traffic from pigeon results, I really only want to do comparisons for traffic on ONE PAGE when comparing time periods. Probably the home page. Clearly the landing page where local results fall.
If I have an article, blog piece, that promotes my services and a couple of particular towns….and it gets HIGH VISIBILITY I could be getting organic traffic from certain towns and not LOCAL/Maps traffic. I’d do the comparisons by landing page focusing on the page that receives Maps traffic.
Of course I’d only do the analysis for google traffic. Rule out everything else…if I’m trying to track the “impact of pigeon”.
Ultimately since Google snatched away every reliable vestige of Organic keywords I’m at a loss. Typically my maps/local visibility shows for a wide variety of phrases.
As you note, we have NO idea about that. What a pity. A law firm with a set series of categories/services might have better pigeon visibility for some categories and worse for others. Your methodology doesn’t touch on that.
Its a tough tough tough effort. Google has made it EXTREMELY DIFFICULT to provide deep analyses that have meaning.
After working on this type analysis for a period following pigeon’s inception and continuing to do so for a while for businesses where we track tons of data and have tons of adwords data, I stopped doing it.
It wasn’t giving me worthwhile meaningful information.
As I pointed out to Chris, y/y is valuable but would provide little insight into Pigeon.
What this report does show you is where were folks searching and where are they searching from now. In a metro market like Buffalo that could be used to better target newspaper and radio ads rather than blanketing the city.
Per your comments:
“What this report does show you is where were folks searching and where are they searching from now. In a metro market like Buffalo that could be used to better target newspaper and radio ads rather than blanketing the city.”.
Those are great insights and uses. We’ve used them. We take the zip code data from adwords (user location-dimension). We take the analytics data (less helpful for zips within cities) and we take addresses of actual leads and sales.
All in all that paints a picture of potentially excellent target areas for zips by certain demographics. It works in our experience.
On the analysis for testing pigeon versus testing for business results….I don’t have a lot to say.
If I were testing for just pigeon I’d still only look at traffic by location for the single landing page where pigeon results appear, I’d still of course filter for only google search results, and after all is said and done I’d like to get a sense for that landing page of the type of searches that land there.
In our experiences we had a reasonable volume of long tail searches that land on the “landing page in question” that were the result of organic searches definitely not from a Map result or pinned result.
So if we wanted to measure Pigeon we might factor the total by a percentage (case by case….and really dependent on having earlier data when google wasn’t blocking all keyword data.).
Its freaking unbelievable how much long tail there is in the aggregate and then some of it generates a map and some of it doesn’t. Either way some of it can land on the home page and/or the page where a maps link lands.
Mike: I checked some old data before Google took away keyword analysis.
For 3 months for 1 smb:
About 15,000 visits from search (didn’t factor out google from other SE’s)
About 8000 visits to the home page where Maps delivers visits from the maps view
Almost 1700 different keywords in the analysis
About 1500+ of them hit the site 4 times or less.
That is a lot of long tail.
How many are maps driven and how many not. I can’t tell precisely, nor have never focused on that, but I know from the phrases that VERY significant volumes are driven by non maps searches. A lot of them are Discovery Phrases having nothing to do with the name or ID ing the business.
Its simply a difficult task. Google makes it more difficult by hiding lots of data.
Its more and more like a billboard advertising company.
If I spend $10,000/month on billboards do I have any idea how well the billboards worked?
Do I know how many cars and people drove by the billboards? NOPE
Do I know how many looked at my ad on the billboard? NOPE
Do I know how many who looked got a sense or context of my product on the billboards? NOPE
Do I know how many bought b/c of the billoboards? NOPE
Extreme example…but we have far less data today than we did a while back.
By the way Long Tail is simply enormous. Even if you don’t see it in google you can see it in bing and in my case I do a lot of stuff on adwords…and its simply huge.
We’ve always generated leads and sales off of long tail. It makes the analysis difficult and then the issue is value.
In our case after doing what you have done with 3 written articles…we kept pounding away at studying this.
It didn’t provide helpful value from a business side. Too much is unknown.
Mike: I’m yammering away on this issue. Partly I suppose because I simultaneously worked on it in a similar vein before dropping it as I wasn’t seeing value from a business sense.
I just saw value.
A colleague called. He has a client wherein leads have dropped somewhat recently. High end service. A reasonable amount of competition in a major urban market.
Overall traffic volume to the website is about the same between when leads were good and when leads dropped. What are the causes???
These are the types of issues when one pulls out ones hair and struggles. We eyeballed various issues. He used me as an outside set of eyes. I deal with these things all the time.
Our set of suggestions:
1. Start coordinating with the client on various pieces of data to try and get clarity. Again and again I find that there is a “distance” between web stats and leads and sales. That is especially true for high end services or pricey services. The buying process is more involved.
2. We identified some “possible” causes off of root looks at the site and search phrases in how the competition looked. There were “several” issues and several possibilities.
3. One was Geographic. That is where Pigeon comes in. We looked at Google search results from “promising areas within the metro region” wherein the client gets customers.
Local Serps and organic serps were different dependent on the point (or suburb or zip code) from where we looked. Pigeon could be affecting the quality of leads from the more promising and logical neighborhoods and suburbs.
(parenthetically with some regional type smb’s I’ve been looking at this for a while. I’ve seen the Pigeon “kind of results for a while”. They are FAR MORE PRONOUNCED in my estimation since PIGEON was announced.–I think google has increased the ampage and importance of searcher location)
The colleague is going to look at traffic in a manner similar to what you’ve done in the above and previous studies.
I acknowledge. That might be a clue. I strongly believe though one must tie the web analyses with actual ongoing business activity to really get a fix on all these web changes and impacts.
If I get feedback later I’ll report in.
Dave
I am glad you found some value in the view of the report. As you and Chris ascertained, its not a general report but it should help you understand certain shifts we have been seeing.
Mike: We look at shifts in endless ways. We try and take them out of the web world and tie them to the business results.
We look at all the following tied to the following results that impact the business:
Web data against leads
Web data against sales
I don’t care about it other than how we can impact total leads and then total sales.
We look at leads because its the beginning of the real sales funnel.
One could suggest that web traffic is part of the sales funnel…but its a very weak part. Half of site visitors or more are LOOKERS/ not potential BUYERS. Not unusual.
In the case of the colleague mentioned above he/she can look at dozens if not more reasons why his clients leads are down.
Traffic inside the site. Time spent on pages, flow of traffic, use crazyegg or a tool like it to ascertain where visitors are going, etc. where do people drop off the site, etc etc etc.
He can analyze all that before and after leads fell off.
By training and experience I’m very oriented toward geography and demographics for certain businesses.
It was a suggestion. One of many.
Weirdly here is something we found for 2 of our own sites post pigeon. Yelp traffic halved.
Now with those smb’s we speak with the customers. Enormous volumes of buyers read reviews. Frankly of the buyers that referenced reviews many of them referenced Yelp by name. (of those that referenced reviews as an important factor–more than half of them referenced Yelp).
For both these smb’s yelp traffic halved since Pigeon. I wonder how many folks are seeing things of that nature?
By the way I went and looked at both google and Bing for hair stylists San Francisco . Google has 3 yelp organic results above the PAC. Bing has one (of course the Bing PAC lists yelp reviews).
Can’t speak about pigeon’s impact on yelp across the board, but immediately post pigeon for 2 of our smb’s (where there are significant yelp reviews) yelp visibility dropped significantly.
Not helpful in our cases. So many different variables to look at.
@Dave
The anecdotal story about Yelp is very interesting. Yelp’s SEO strategy was very urban focused. Could i be that they are not doing so well on the uber suburban results that Google is showing?
Its anecdotal. I threw the question out to other local seo’s. So far nobody has seen what I’ve seen. I’ve tested visibility for 2 totally different smb types in our area and I tested it on phrases with the city name.
Yelp dropped in organic serps in all the search terms. Don’t know why. In our cases we tested the drops in traffic to the sites. Traffic was halved starting with the first day of pigeon.
But nobody else has seen or experienced that. Could be an anomaly. I was thinking it could be an internal yelp move but the drops completely coincided with the first day of pigeon and traffic has consistently remained 1/2 of what it was before.
Interesting information Mike, thanks for sharing. It makes sense that Google would want to center search around the searcher rather than city-center. Any indication as to whether the “searcher centered” search crosses city boundaries? i.e. if the searcher is near the city-limits of a city and searches, will the search include results from the neighboring cities that may be closer to them?
Mike:
Moreover in the regions where I’ve checked the cities were certainly yelp targets and are “yelp strong”.
At least on the restaurant side (the number 1 review target) in the suburbs and very far out outer suburbs of those target cities the yelp visibility is VERY strong. Yelp oriented Serps are high by restaurants by name and restaurants by category.
Its not urban versus suburban in my view and testing but more related to markets. I tested a lot of markets including a sizable number of mid American mid sized non coastal cities for restaurant reviews. Clearly there are urban markets representing smaller cities/smaller metro areas where yelp is less strong and less visible. On the other hand in large urban markets (cities and their suburbs) where yelp targeted I see them every bit as strong and visible…certainly in the restaurant categories across the board.
But for the 2 very narrow, very niche markets I’m involved in and I tested post pigeon yelp visibility took a hit any way you search for the industry or by business name.
The hits occurred completely coincidental with the date pigeon was unleashed.
Before pigeon yelp was showing pretty high in organic serps in more than one way. SMB’s with yelp reviews and stars were showing and a yelp page for the category/city/urban market were showing.
Now the yelp category pages for those niche industries aren’t highlighted in the serps. The smb’s in those categories with yelp stars are showing…but slightly lower in the serps.
But I’ve been checking with Local SEO’s around the country. They aren’t seeing what I’ve seen.
maybe they are such small niches pigeon’s influence pushed those niche verticals/ industries down as the industry might have little internal yelp link power going into them.
While I haven’t been focusing on this I’ve read some organic analysis suggesting internal link power has been diminished.
As I look through some of the suburban areas in yelp strong urban markets….it could be the further one goes out to the edge suburbs the weaker the yelp industry pages in the serps. Specific smb’s with ample yelp reviews seem to show pretty strongly.
Really haven’t been testing this though so its a lot of supposition. I only looked at it post pigeon as the yelp driven visits to these smb’s dropped by a noticeable amt post pigeon.
Mike:
I started looking at data as to leads per community/town per year over a very long time period: Over a decade. I’ve been looking at it for one of our smb’s that is in a dense urban environment. Its regional. In that sense there is a spread of traffic….and of leads and sales that represent many communities. I think that is reflective of the data that you showed for both the law firm and the jewelry store. You were capturing traffic by town…and there are quite a few towns in each region. For this smb its in a denser metro region…hence more towns; probably in excess of 100 that feed potential business. That might mean as few as 4-10 leads/year to well more than 100…or possibly a number of communities or the major city(s) with over 100/year.
A lot of diversity from a geo perspective. I’m not tracking it directly against pigeon, but over time I’m aware of changes in google’s presentation’s that have favored or reduced visibility in different towns, and different regions or quadrants. Those changes have been either a function of google’s changing algo’s or of competition.
But its clearest when both the algo’s and competition come into play. Clearly with “localism” (proximity) playing more of a factor over the last few years….competitors in any one area make a significant difference.
There are other factors; market conditions, leads from sources other than search visibility, leads from sources other than LOCAL visibility, etc, leads from the long tail, that is clearly not LOCAL (at least with an accompanying map or LOCAL presentation. etc etc.
The logic of tracking by community does make sense. How to “beat it” in various ways, whether by LOCAL or a different method is the key or answer.
So far I’ve only looked at 3 communities over the “possible 100”. I’ve chosen a few with definite changes over the time period that might be reflective of changes via Google’s algo’s/ and differing competitive situations. There are differences over time. On the negative sides there are drops in total leads/ per community from the max to about 30-40-50% less wherein I’d guess that competition and changing algo’s led to fewer leads. It gives me hints on where to increase visibility whether through organic efforts or other efforts.
Its granular data…but in the aggregate it has an impact and the impact could be significant.
Dave
Thanks for the thoughtful follow up and validation of the idea. I love your thinking but as you point out, figuring out how to use the information and benefitting from that is key.
As a side note, I think one of the things that changed with Pigeon was that Google better understood where someone was located so that the change in visitors to a different town might be a result of that (in addition to the other factors you mentioned).
Mike: Over a number of years I’ve noted that google has provided more granular geographical data with regard to impressions via adwords. Following that evolution, over the last year or two Google Analytics has provided more granular geographical data; For instance in the greater DC area for years we had locational data for a relatively expansive suburban community named Bethesda. In the last year or two we now get GA data for visits from both Bethesda and North Bethesda. We’ve seen many of those type breakdowns with quite a few communities.
Pigeon, as you say, seemed to create a tighter more narrow focus on the searcher’s location for many businesses. In some regards for verticals that have fewer competitors, the ” geography of the map” was expanded. There are fewer of those examples and verticals…but the Pigeon presentation,worked both ways, relative to the industry.
I’ll end up looking at possibly 20 of the hundred or so, with focus on communities which generate the most leads and where we have been cognizant of both positive and negative impacts and develop some strategies around these findings and changes.
Its always a challenge. What is astounding from one perspective is the power google has over local businesses as it changes algo’s, establishes penalties, etc. Really something that was never present in the past. Its unbridled and unlimited. That is something about which to be vigilant.
Mike:
I’m baaaaack ….on this topic. 😀
I find it interesting and analytical. Overall I think it offers some insights but it also is data with holes…some of which I described above. Use it with caution.
Anyway a situation arose wherein it points to another data point wherein the information is not helpful.
I took a call for one of the smb’s. In the conversation the caller referenced an item that relates to a long tail page on that site. Following the call I went back into analytics for the day.
Sure enough the person landed on a long tail page. Then I dug a bit deeper by coincidence and the identifying local town for that visit to the site was FAAAAAAAAAAAAR away in a major city in a state across the Mississippi….and nowhere close to the smb. Looked at “networks” in analytics and that visit was tied to a corporate network for a big company. The IP is identified with their corporate headquarters far far far away.
Completely misleading info on a location basis. The caller works in a location real close to the smb. Real close and convenient.
Anyway our smb’s do get a good bit of traffic from people while at work…If the searchers are with businesses with remote IP’s (for instance an IP for the network assigned to the headquarters city) the geo analysis that you described above and in an earlier article is worthless. We do get significant amts of traffic of that ilk. Not a majority…but significant.
Some of that traffic from NYC and Chicago and Dallas and Rochester etc are people searching just down the street from us or from very close. Some of that traffic hits our home page and would be the same traffic that hits the Local listing in the pac. In our cases when we were diving ever deeper into arcane data….more of that traffic came during days than nights. Its traffic from work places.
Sooooo….if there are big spending wealthy attorneys who have a hankering to buy great jewelry from a local store with great service and say the work in the Buffalo offices ….and they are sitting in an office associated with out of town law firms with IP’s in various cities… a couple of things:
They won’t find local jewelers by searching on “jeweler” or any of its derivatives. They’ll specifically have to search on Buffalo jeweler. And if you happen to chance upon the location of their search…it could be identified as Houston, or Boston, or NYC…when in fact they are working very near that terrific Buffalo jeweler…and that might live in a suburb exquisitely near that shop.
Just sayin……. 😉
Anyway for the potential value of that geo data there are also qualifying reasons as to whether to give it total authority for this reason and other reasons described elsewhere.
@Dave
That’s interesting. Never dawned on me..
I’ve been aware of that for some time, but the impact and possibility slipped my mind until I ran into this situation once again, earlier today.
Geo data from google can be somewhat distorted via IP’s. It definitely surfaces via work calls. If you can connect a visit in G analytics with a city and then a network you’ll see it often is connected to a visit via a corporate network. The view could be from a nearby local office but the IP and the reporting on location is from far far away.
Suppose you are getting a lot of site visits via some corporate network and you can relate them to a far city. You might want to direct market to the people in that local regional office. Hopefully people in that office are speaking well of your service/ products.
Comments for this post are closed.