Understanding Google My Business & Local Search
Traffic to Google Maps increased by 26% from Jan. to Feb.
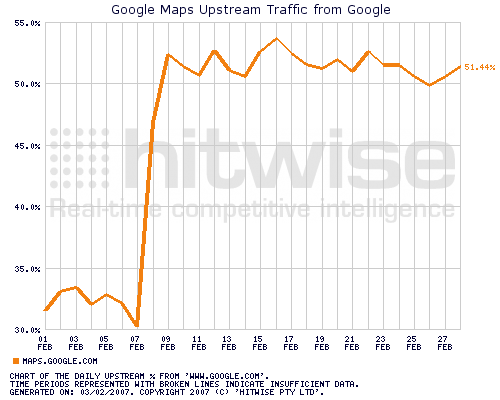
LeeAnn Prescott at Hitwise reports: Traffic to Google Maps increased by 26% from January to February 2007. It appears that this increase was due to an increase in upstream traffic from Google, which occurred on February 7, according to this daily clickstream chart shown here. Did anyone notice a change in how Google drives traffic to Google Maps around this time?

This jump in traffic to Google Maps shown on the chart occurred one week after it was reported that Google upgraded the Local Onebox results on the main search results page.
This jump is more dramatic when you plot just Google Map’s traffic increase shown by Hitwise:
My sense is that the internal traffic boost to Maps is a result of the OneBox change. Why there should be a week lag in the effect is not clear.
*Were there other internal changes by Google in that timeframe?
*Did the change rollout to different servers over that period, hitting larger markets last?
*Is the lag a reflection of user behavior changing over that week?
*Is it an artifact of the measurement process or some coding change at Google that would make the increase more visible?
LeeAnn also asked: How do these smaller UGC-focused review sites compare against the bigger players in local search? Yahoo! Local and Google Maps, which includes local content, received more than 10X the market share of visits of Insider Pages in February 2007.
It points out that, at least on the Internet (as opposed to the mobile search), Local search is Google’s and Yahoo game to loose. Given their control of the search mindshare, they can easily change their approach to capture more market share. It is hard to imagine all of the elements that would be required for this to dramatically change.
© Copyright 2026 - MIKE BLUMENTHAL, ALL RIGHT RESERVED.


Comments
10 Comments
Mike.
Imagine if the Local One Box was showing up on all queries that were local. For instance right now ‘Hotels in Las Vegas’ shows a one box but ‘Las Vegas Hotels’ does not. When Google starts getting this right, they will run away with the market share from the looks of it.
Hi Mike
Yes it does imply awesome market power doesn’t it? And how even moderate change seems to capture increased market share.
I wonder though about the week lag…
Mike
The week lag is strange. I am not really sure how hitbox gets all there data either. I haven’t really dug into them too much. Perhaps that has something to do with it
Ignoring the wierdness connected with the one week lag–this shows the significant impact from maps. As mentioned, not all local or regional queries turn up a maps insert. Also even if the user hits on a maps insert–they may then hit on the website itself. How does Hitwise measure this technical difference.
I know for my business we had a lot more queries that came out of the maps source. We could tell through calls to the business. My logs aren’t showing that the visitors are coming from G maps.
How is hitwise measuring this?
I noticed that links from the local onebox on http://www.google.com point to www sub-domain rather than the maps.google.com subdomain… I wonder, then, if Hitwise is under-reporting Google Maps visits (counting them as regular Google visits), or if Hitwise is able to detect the difference between a Google Maps view and a regular Google view independent of the sub-domain.
Hi Colin
Good point…I had not noticed that before…do they count (access from the onebox via the Local Results link):
http://www.google.com/maps?hl=en&client=firefox-a&rls=org.mozilla:en-US:unofficial&hs=KxK&q=restaurants&near=Buffalo,+NY&sa=X&oi=local&ct=title
the same as (accessed via the maps link at the top):
http://maps.google.com/maps?q=restaurants%20Buffalo%20NY&ie=UTF-8&oe=UTF-8&rls=org.mozilla:en-US:unofficial&client=firefox-a&um=1&sa=N&tab=wl
I don’t really know…a very good question.
Mike
[…] Link: https://blumenthals.com/blog/?p=116Â […]
[…] Last week I reported on a Hitwise report that Traffic to Google Maps increased by 26% from Jan. to Feb. due to an increase from upstream Google traffic. […]
I hear you but Google is not everything as now it’s 2008 and many social networks have boomed their way onto the traffic highway and it looks like their not stopping. The two big shots is Myspace and Facebook and if you’ve seen the data against G then you’ll know where the traffic is. I have a free report in which we use other means to get not just traffic but mind-blowing traffic. I’ll be here.
They drive lots of traffic on the maps when adding the google maps functionality in the search results. In the last weeks they increased the number of search results with local results a lot, so there might be even a jump in traffic this months.
Comments for this post are closed.